Saudi fleet solutions built around your needs

Rooya helps you turn real driving footage and vehicle data into practical steps that improve safety, develop driver performance and increase operational efficiency. We configure our solutions around your vehicles, routes and everyday fleet challenges.

Request a Demo
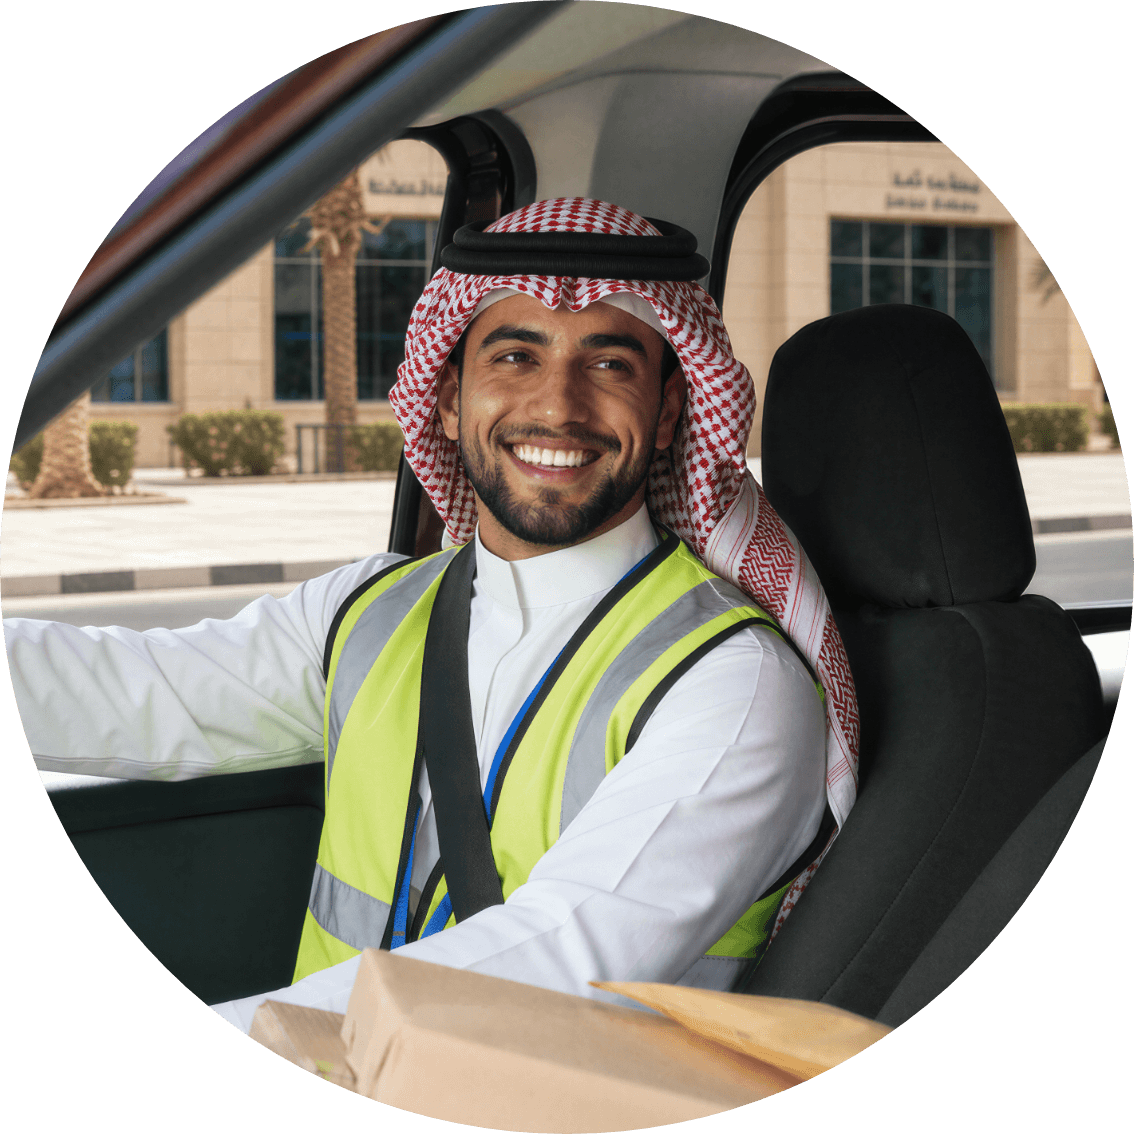

Illustration of Rooya's fleet risk dashboard
Event detected Driver fatigue Date 21/06/2026 03:21:21 Severity High
Driver behaviour This week
84 Good
  • Speeding3
  • Harsh braking2
  • Distraction1
  • No seat belt0
  • Fatigue0

Solutions Designed for Your Fleet

Rooya driver score dashboard showing behaviour events

Driver Behaviour & Fatigue Monitoring

Identify early risk and fatigue indicators and alert drivers in real time to support safer driving.

Learn more
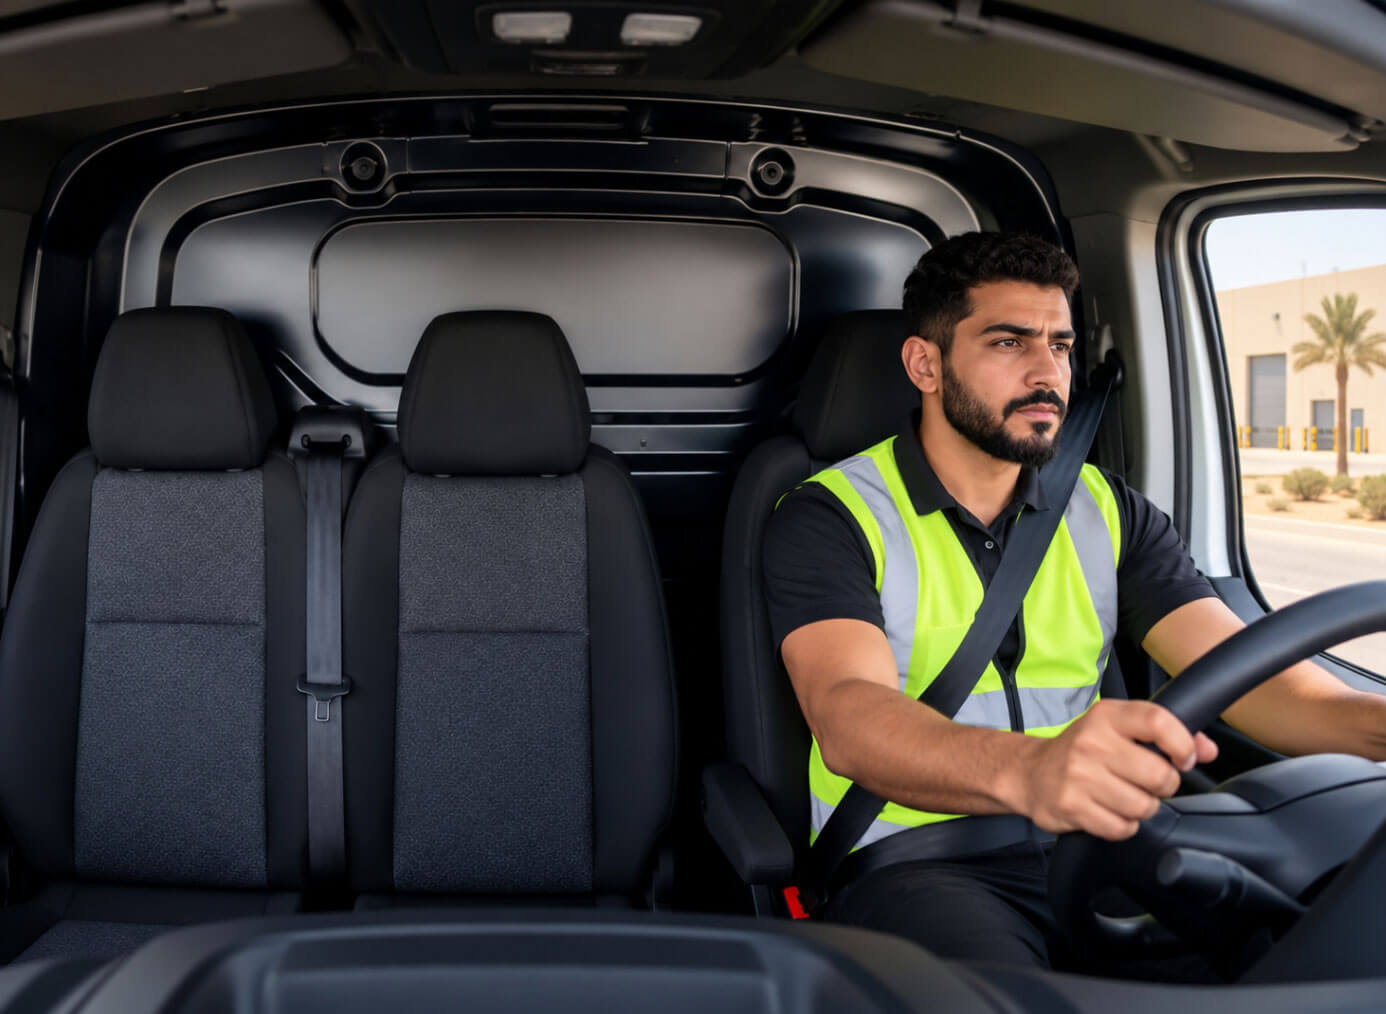
Driver being monitored for fatigue and behaviour

Fleet Safety & Risk Management

Tools to help reduce incidents, support your team’s safety and manage operational risk.

Learn more
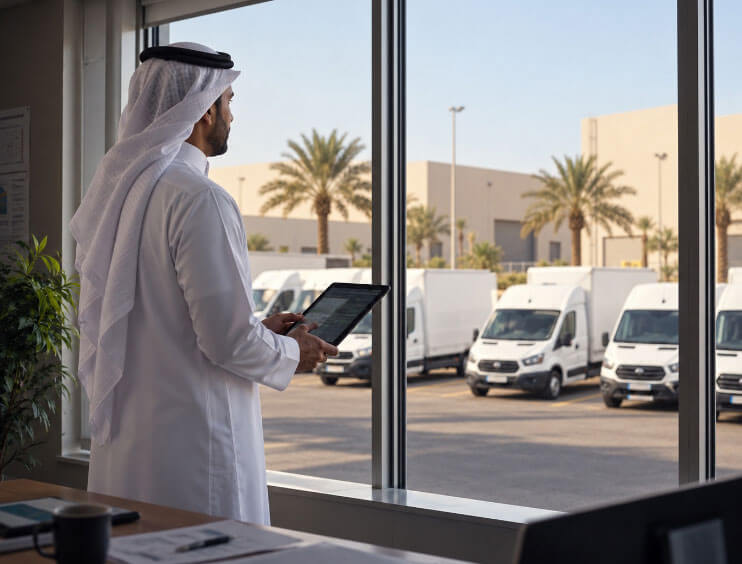
Video evidence used to review an insurance claim

Fleet Optimisation

Use journey patterns and driving data to identify waste and improve the way you use your vehicles.

Learn more
Driver Behaviour & Fatigue Monitoring

Identify risks before they escalate

Early warning signs such as fatigue, distraction, rushed decisions, repeated harsh manoeuvres or changes in driving habits can appear before accidents occur.

Rooya helps your team understand these warning signs and intervene fairly and at the right time. Rather than treating every event as a separate fault, managers can decide whether a driver needs coaching, support, a route review or a conversation.

Where this helps

  • Fatigue risk

    Identify signs of reduced attention and support drivers before tiredness becomes dangerous.

  • Distraction

    Give managers context around in-cab behaviour without relying on guesswork.

  • Repeat patterns

    See when the same risks keep appearing across drivers, shifts or routes.

  • Fairer intervention

    Use real context to separate one-off moments from habits that need support.

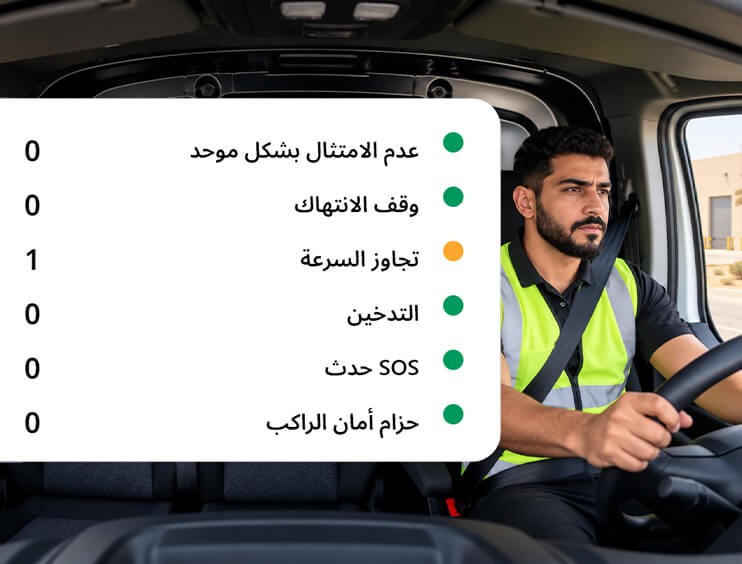
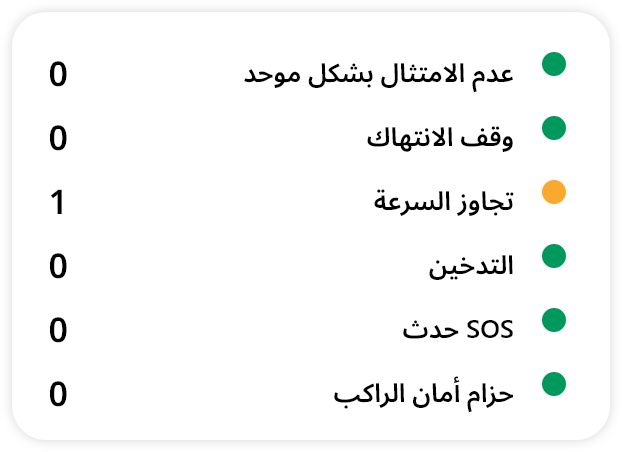
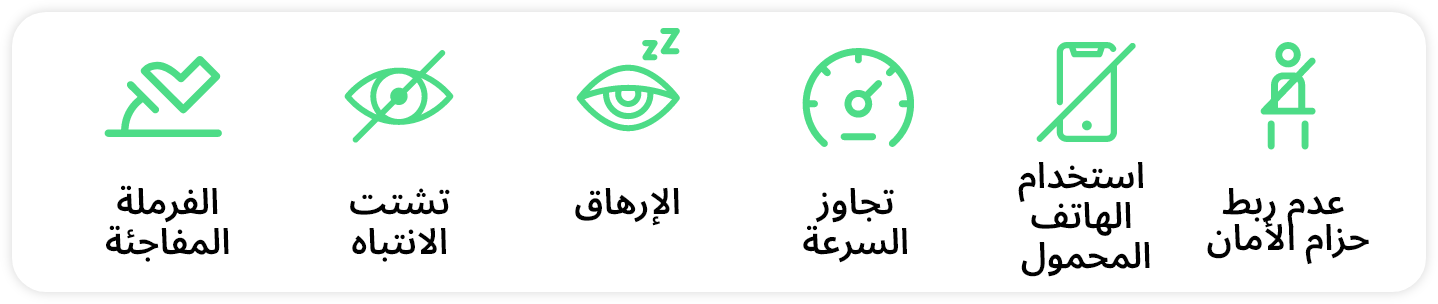
Driver at the wheel of a van, wearing a seatbelt This week's event counts: one speeding event, everything else at zero Detected behaviours: harsh braking, distraction, fatigue, speeding, mobile use and no seatbelt
Fleet Safety & Risk Management

Get a clearer view of fleet risk

When driver, vehicle and incident data sit in different systems, understanding fleet risk becomes difficult. Rooya brings this information together to help safety and operations teams review events, monitor performance and identify improvements.

Tools That Support Safety Management

Rooya safety oversight dashboard bringing incident and claims data together

Clearer Incident Records

Keep a clearer record of events, outcomes and supporting evidence across the fleet.

Risk reviews

Give managers better information for safety meetings, performance reviews and action planning.

Tracking Safety Procedures

Help teams understand where safety processes are being followed and where gaps remain.

Evidence for Incident Reviews

Connect event clips with journey data to clarify facts and support internal reviews and communication with relevant parties.

Continuous Safety Improvement

Track whether safety activity is helping reduce preventable incidents over time.

Rooya helps make safety easier to manage as a live operational process, not just something reviewed after an incident.

Fleet Optimisation

Reduce waste and improve fleet efficiency

Journey data and driving behaviour can reveal opportunities to improve operations, from reducing unnecessary mileage to addressing habits that increase fuel use. Rooya helps you understand these patterns and identify practical actions.

Optimisation in practice

  • Driving style and fuel

    See the harsh acceleration, speeding and excess idling that push consumption up, and coach the drivers responsible.

  • Understand Stopping Times & Operations

    Review vehicle stopping times alongside journey context to identify opportunities to improve daily operations.

  • Route visibility

    Review journey patterns, stop-start activity and route history to understand where time and mileage are being lost.

  • Fleet efficiency

    Use clearer operational insight to improve daily decisions without relying on guesswork.

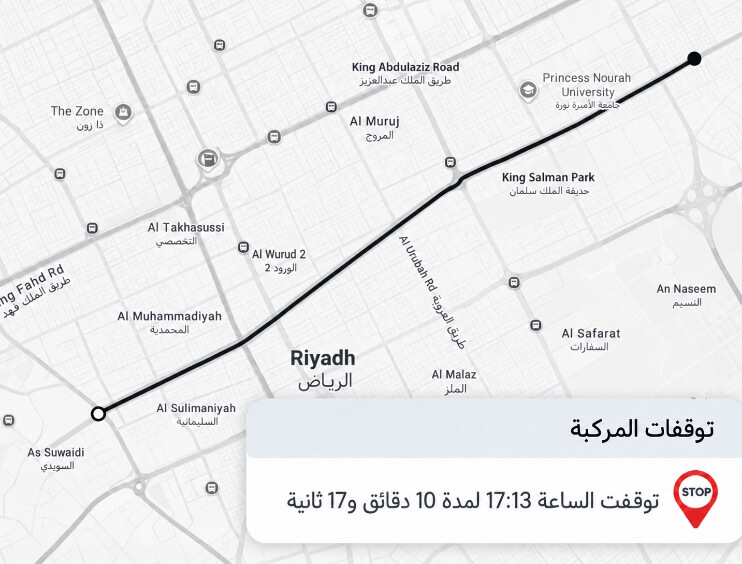
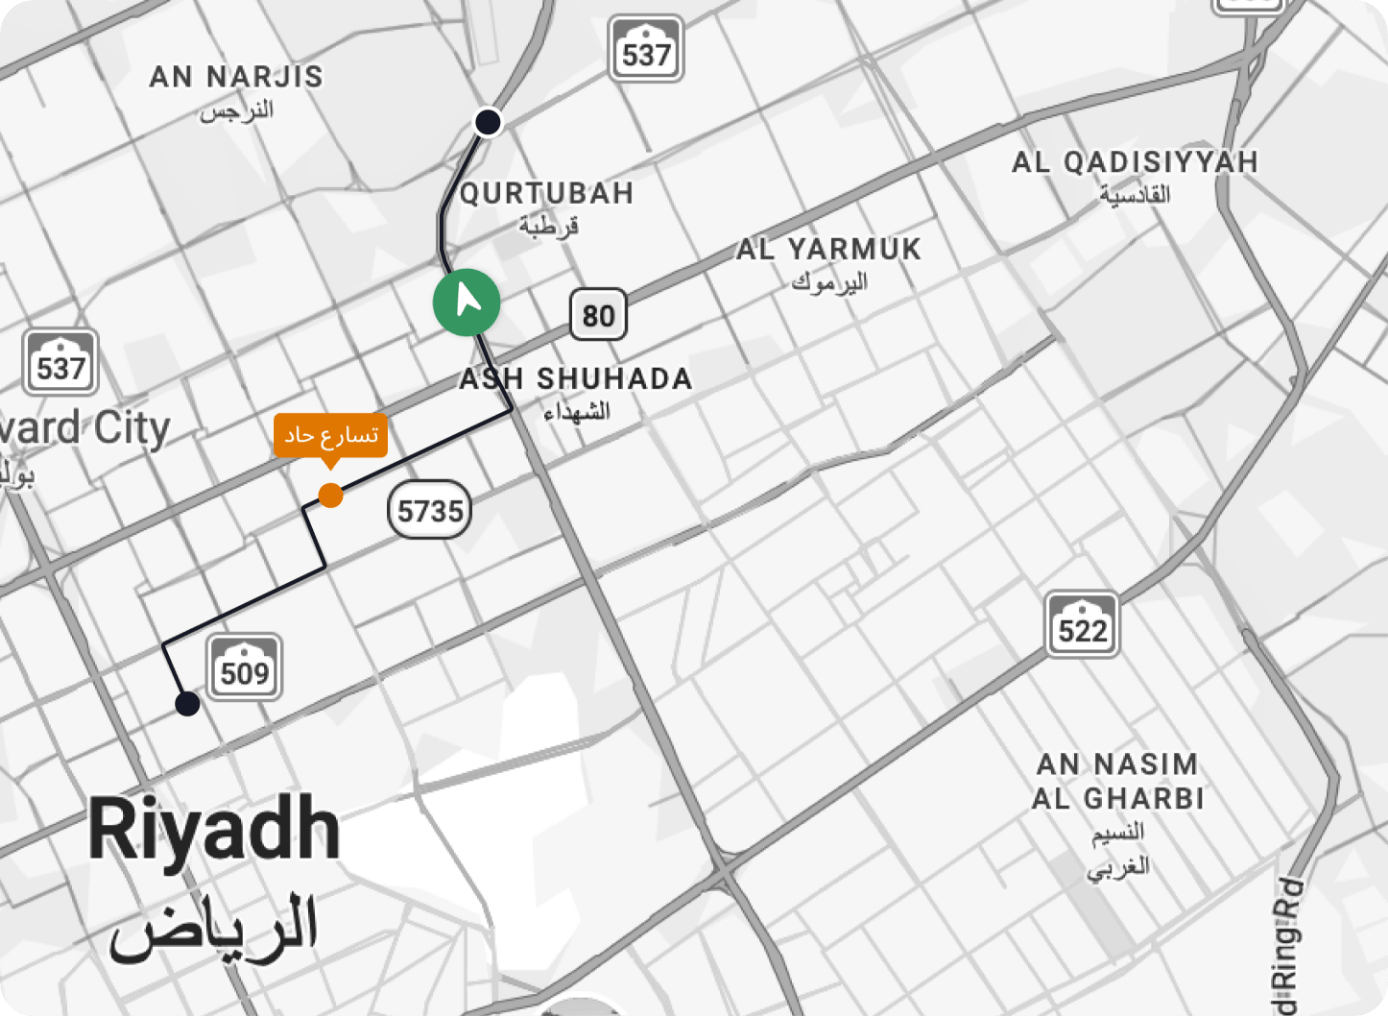
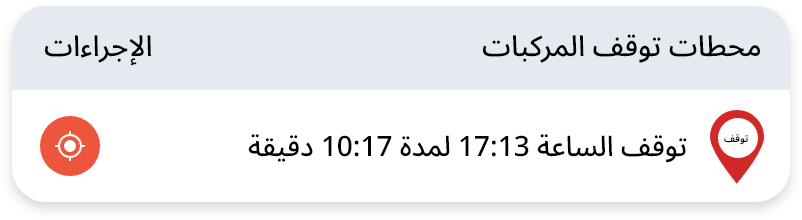
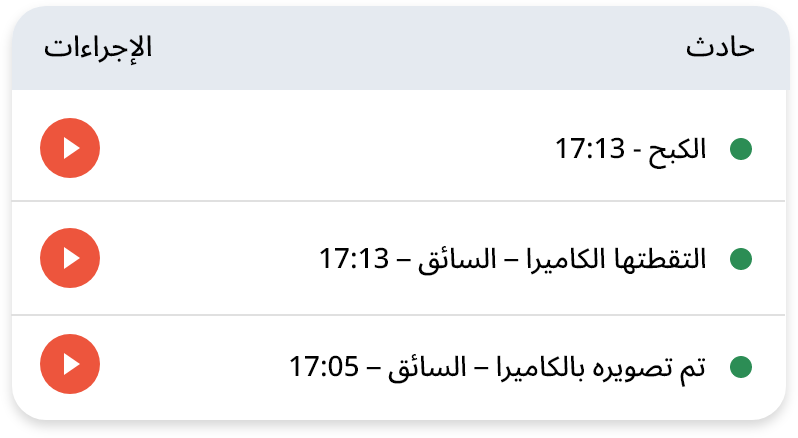
Route map with the vehicle's stops and incidents marked Vehicle stops: stopped at 17:13 for 10 minutes 17 seconds Incidents: braking at 17:13, camera covered at 17:13 and 17:05

Have different fleet requirements?

We start with your operating challenges, not just an industry label. Talk to our team about your fleet so we can identify the right solution.

No commitment. We’ll be in touch within one business day.